Pennsylvania...LFG
Pennsylvania...LFG
You are looking good for Harris. Amidst polling uncertainties boosting Gen Z and Millennial turnout is crucial for Harris to secure victory: A full sensitivity analysis of scenarios.

When trying to predict election outcomes in a key state like Pennsylvania, many factors come into play. Population data is crucial because it helps us understand demographic shifts, voting habits, and how different areas might vote. By combining this with things like past voting trends, current polls, and estimates of how many people will vote, we can make more educated guesses about what might happen in an election. This combination of data helps analysts get a clearer picture of which way the state might lean in the upcoming vote.
However, as I have stated before, relying heavily on individual polls or past data can be misleading due to various sources of error such as sampling biases, question wording and order, respondent demographics, survey mode (phone, internet or in-person) and response rates. Generally, polls become more accurate as the election approaches, and the combined results of several reliable polls are usually more dependable than any single poll.
What remains true is that each demographic group often exhibits unique voting patterns. For example, in Pennsylvania, younger voters (ages 18-34) tend to lean Democratic, favoring candidates like Kamala Harris by a significant margin in recent polls. In contrast, older voters (ages 50-64) tend to support Republican candidates, such as Donald Trump (Quinnipiac Poll, September 18, 2024). This year in PA, voters age 65+ have been favoring Harris more and more. Between August 16 and September 18, Quinnipiac polls showed a 3% increase in favor of Harris and a 3% decrease against Trump across older age groups, signifying a stark shift in voter preferences.
The simplest analysis can be carried out by looking at the age demographic breakdown of Pennsylvania’s population, along with electoral polls to estimate the total support base for each candidate.
Interestingly, John Burn-Murdoch's analysis in the Financial Times highlights a significant shift in voting behavior among older millennials, who are not following the traditional trend of becoming more conservative with age. Historically, it has been assumed that as people grow older, they tend to lean more conservatively. However, Burn-Murdoch's findings suggest that this is not the case for millennials (those born between 1981 and 1996) in both the UK and the US.
The research shows that while older generations, such as Generation X, Boomers, and the Silent Generation, have shifted towards more conservative voting patterns as they age, millennials are not adhering to this trend. One key reason could be that millennials grew up in the aftermath of the global financial crisis, facing unique challenges such as housing affordability and economic insecurity, which have shaped their political attitudes differently from their predecessors. Additionally, cultural and social issues play a role, as millennials are generally more progressive on topics like education, climate change, and social justice, making them less likely to support conservative policies or parties. For conservatives to appeal to millennials, they would need to address these generational concerns, such as housing affordability, childcare, and distancing themselves from divisive culture war politics.
This shift in voter behavior could have significant implications for this AND future elections, as millennials represent a growing portion of the electorate and could challenge long-standing assumptions about political alignment and age.
Where are we now
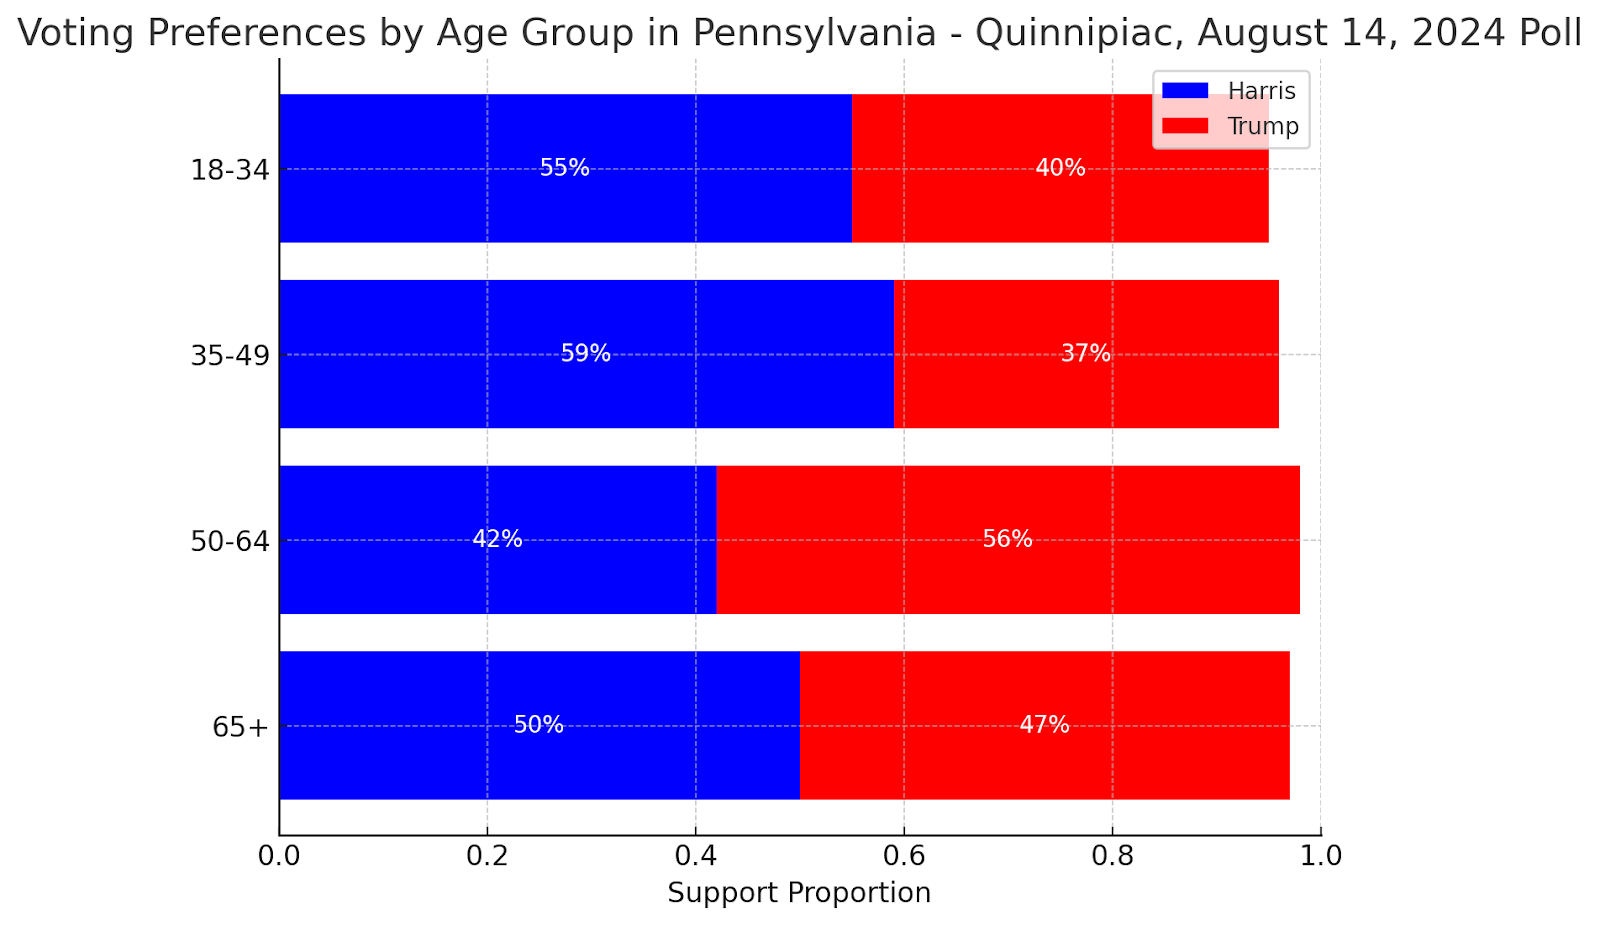
Some of the most recent pollster data from Pennsylvania for the 2024 presidential election, stratified by age group, comes from a Quinnipiac University Poll. According to this poll (if the election were today, this includes other candidates but not RFK Jr. ):
Ages 18-34: Harris has 59% support, Trump has 37%.
Ages 35-49: Harris leads with 48%, while Trump has 47%.
Ages 50-64: Trump leads with 56%, and Harris has 42%.
Ages 65+: Harris leads with 53% and Trump at 44%.

According to this latest Quinnipiac poll Harris gained considerable support across all age groups, except 35-49 year olds. I will come back to why these numbers may be misleading, and how we can analyze the outcomes to account for the margin of error.
Around 2% of voters in Pennsylvania remain undecided. Third-party candidates, such as Robert F. Kennedy Jr., were polling at about 4% in Pennsylvania.
After Kennedy dropped out and endorsed Trump, most polls indicate a slight shift in voter preferences in Pennsylvania. Emerson College polling shows Trump has a small lead over Harris at 49% vs. 48%, with a small percentage of voters remaining undecided. This poll also indicated Harris maintained a lead among independents and younger voters, while Trump had an advantage among male voters. The small lead is within the margin of error between the 2 candidates, and thus, at best a coin toss.
We can use this information, alongside 2023 population (by age) data to, on the first order, model potential outcomes, with the caveat being that there is uncertainty around voter turnout, especially the youth vote - which can significantly change an election outcome. This is because there are twice as many eligible voters aged 18-44 relative to those 65+, who can lean more conservative and show up in larger numbers. There is also unpredictable voter sentiment that is quite susceptible to last-minute changes - we will try to model that too.
In the 2020 U.S. presidential election, Pennsylvania saw a voter turnout rate of 66.79%-69.93% of the voting-eligible population (VEP). This was an increase from the 2016 election, when the turnout rate was approximately 61.15%. This jump in voter participation reflects a broader national trend of increased voter engagement in the 2020 election, attributed to factors such as heightened political polarization, widespread mail-in voting due to the COVID-19 pandemic, and significant efforts to mobilize voters from both major parties.
Specifically, there were 6,915,283 votes cast on November 3rd, relative to 9,090,962 registered voters and 10,353,548 total eligible voters. Other sources place the estimates closer to 6,958,551 cast votes, thus explaining the range of values in voter turnout.
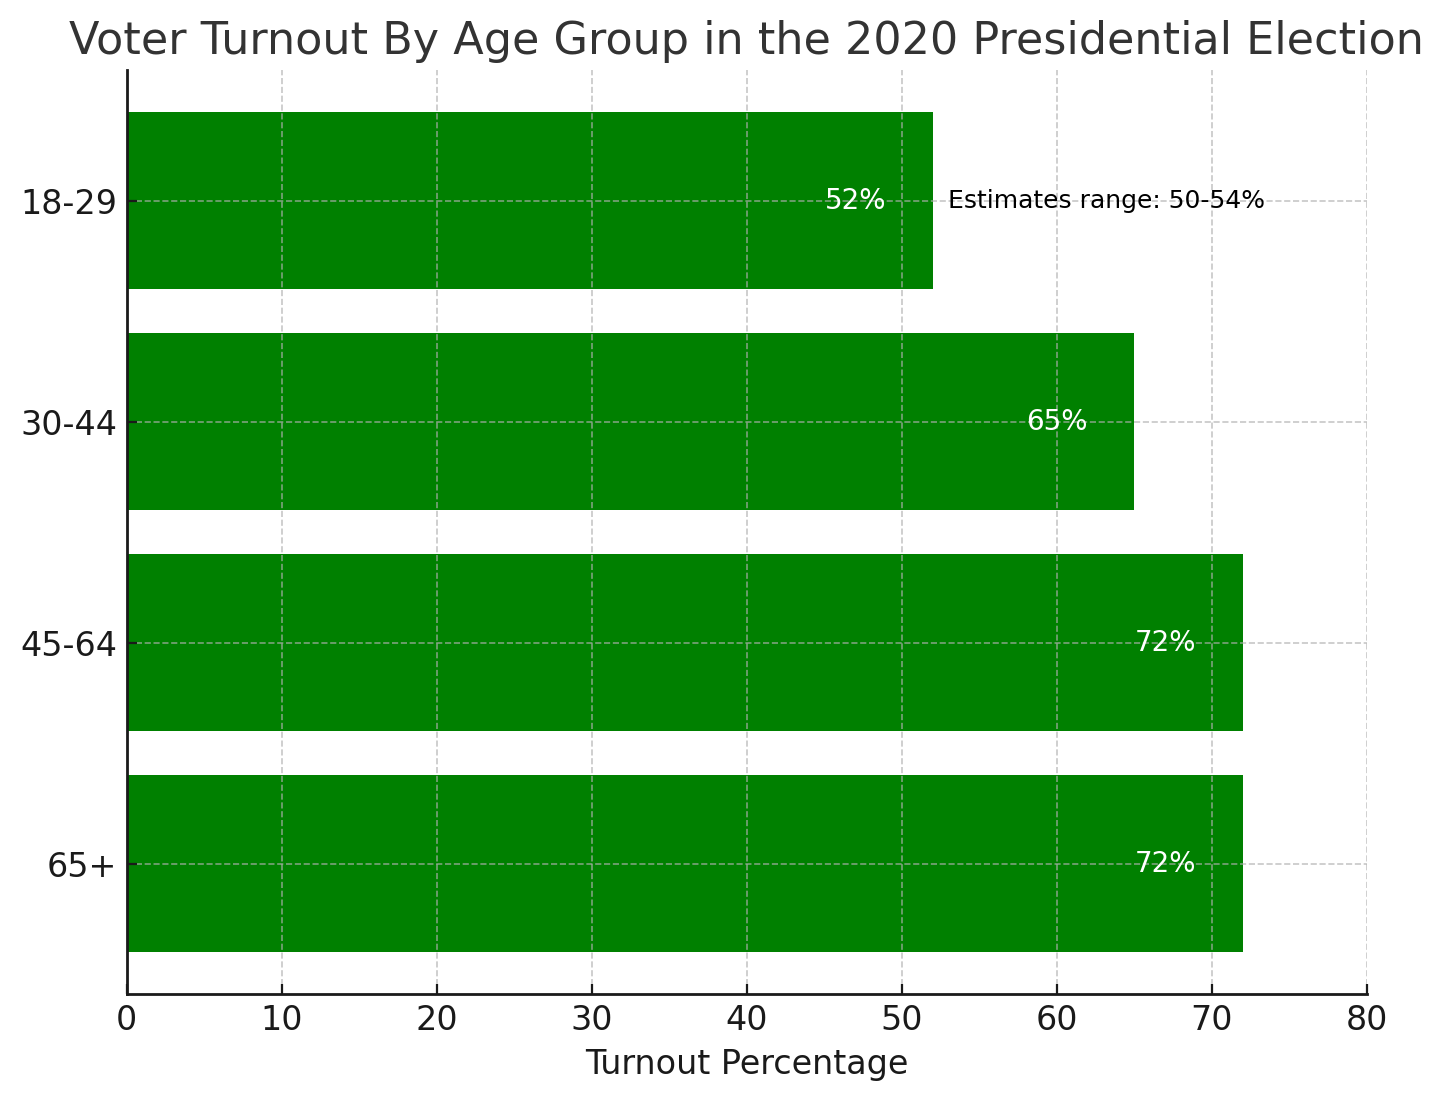
Generally, younger voters (ages 18-34) had a lower turnout rate than older voters, which is consistent with national trends. In Pennsylvania, turnout among 18-to-29 year-olds was between 50-54% in 2020, higher than all but just 10 other states. While lower than older age groups, represented an increase of 7 points compared to the 2016 election. Youth aged 18-29 represented roughly 14% of the voters. In contrast, older voters (65 years and older) in Pennsylvania had the highest turnout rate, typically exceeding 70% and comprising around 27% of the voters. Older voters generally have higher turnout rates due to a variety of factors, such as more established voting habits, a stronger sense of civic duty, and greater political engagement. A breakdown of voter turnout (eligible voters, not registered ones) by age and voting preference, as gathered from exit surveys in the NY Times, for the 2020 presidential election is summarized below:

According to Khelan Bhatia, AARP's director of voter engagement, voters aged 50 and older have been key in determining election outcomes in recent years, comprising 55% of the electorate in 2020 and 65% in 2022. AARP's 2024 battleground state polls suggest that these older voters are more motivated to vote, and have the time (4 in 5 65+ are retired) than their younger counterparts, indicating they are likely to play a decisive role again in this year's election. This is why we need to increase turnout amongst youth voters. In the end, they have more at stake given they have longer time left to live under policies that may conflict with their values.
The Need to Account for Errors in Polling and Turnout Data
Voter sentiment in 2020, as gathered from exit surveys in the NY Times, was similar to that observed in the August 16 Quinnipiac poll, or at least within the margin of error between the 2 candidates. Now if we would believe that data from this exit survey to be entirely true, and plugged in the numbers from this survey using 2020 population data for PA for those ages 18 and up, Biden would have beat Trump by over 200,000 votes! However, Biden won PA by only about 80,000 votes! What gives?
In reality, an exit survey, like polls, is influenced by sources of error such as sampling biases, response rates etc. As such, we can take polling or survey data at face value. A survey from the NYTimes likely had sampling biases that may have overrepresented voter sentiment in favor of Biden. Changing voter turnout numbers does not change the results much, but tweaking voter sentiment in favor of Trump does… A lot. If we increase support for Trump by 2-3% and decrease support for Biden by the same amount amongst older voters, we arrive at roughly a difference in votes of around 79,000! Close enough, huh?
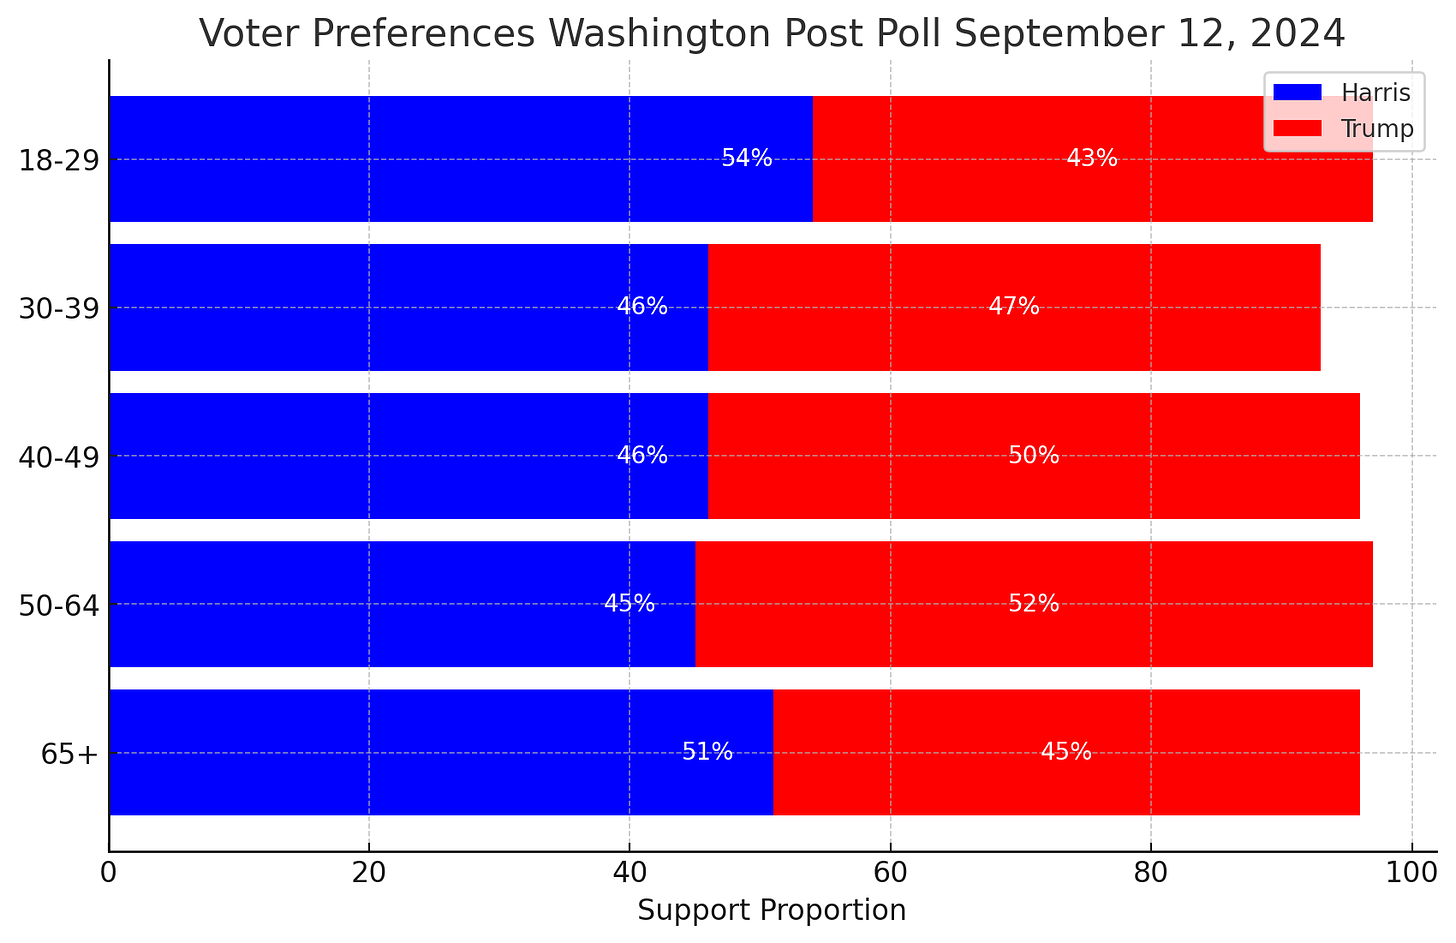
Even more importantly, a recent poll by the Washington Post shows somewhat different voter preferences in PA:
Ages 18-29: 54% Harris and 43% Trump
Ages 30-39: 46% Harris, and 47% Trump
Ages 40-49: 46% Harris and 50% for Trump
Ages 50-64: 45% for Harris and 52% for Trump
Ages 65 and over: 51% Harris and 45% Trump.

This is exactly why, when looking at polling data and voter turnout predictions we must account for the margin of errors and examine a range, rather than a single-point estimate. A typical poll won’t do that. However, a sensitivity analysis will!
Modeling Outcomes
To model potential outcomes in PA we must use a sensitivity analysis, changing voter turnout and voter preferences (assuming the polls are wrong, which they typically are). A sensitivity analysis is a way to see how different choices or changes can affect the outcome of something. Imagine you're baking a cake and want to know how the taste might change if you add more sugar, use less flour, or bake it longer. A sensitivity analysis would be like trying out each of these changes to see which one makes the biggest difference in the final taste of your cake.
In more general terms, it helps you understand which factors are most important in influencing the result and how small changes in these factors could change the outcome. It's like asking, "What happens if I adjust this?" and seeing how much it matters.
By adjusting the turnout rates (and voter preferences) for younger voters (ages 18-34), middle-aged voters (35-49), and older voters (50 and up), we can create various scenarios to predict how shifts in these groups' participation (and attitudes) might impact the election. If younger voter turnout, traditionally lower, increases by a significant margin, this could tilt the election outcome toward Harris. Conversely, a decrease in turnout among older voters, who generally have higher participation rates and may lean differently, could also dramatically affect the results. By recalculating total votes under each scenario and assessing which age groups most influence the election's outcome, campaigns can strategically focus their resources on mobilizing the most impactful voter segments. This approach allows for a better understanding of the potential variability in election results and helps to refine campaign strategies accordingly.
First, we will make use of the most recent pollster data from Pennsylvania for the 2024 presidential election, stratified by age group, from a Quinnipiac University Poll.
Voter turnout was high for voters aged 45 and up in 2020, sitting at 72%, according to the NY Times survey. First, I wanted to analyze the impact of voter turnout on the election outcome in Pennsylvania under different scenarios.
In the first, scenario, I defined the total number of eligible voters across different age groups (18-34, 35-49, 50-64, and over 65) from the Census data projections for 2023, and set the voter turnout rate at 72% for the older age groups (50-64 and 65+). In 2023 Census data projected 2,825,942 PA residents aged 18-34 and 2,372,097 residents aged 35-49. There were 2,536,225 residents aged 50-64 and 2595674 65 and over.

I assigned specific support levels for Harris and Trump across each age group based on the Quinnipiac Poll. I then generated a range of turnout rates for the younger age groups (18-34 and 35-49) sweeping from 30 to 80% turnout, while leaving the voter turnout in the other categories fixed.
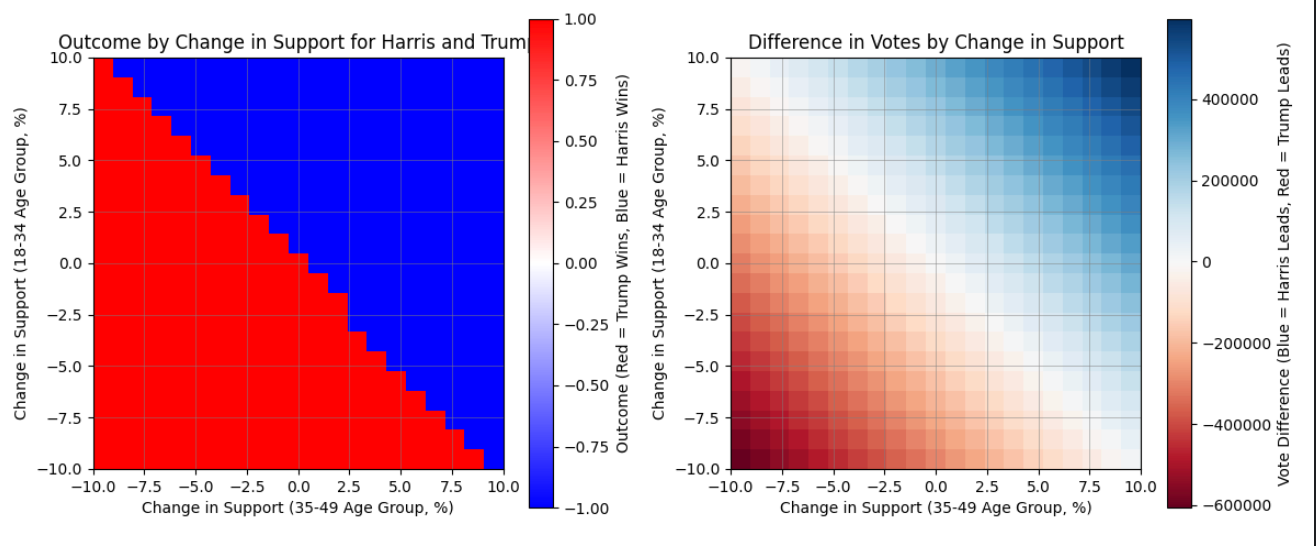
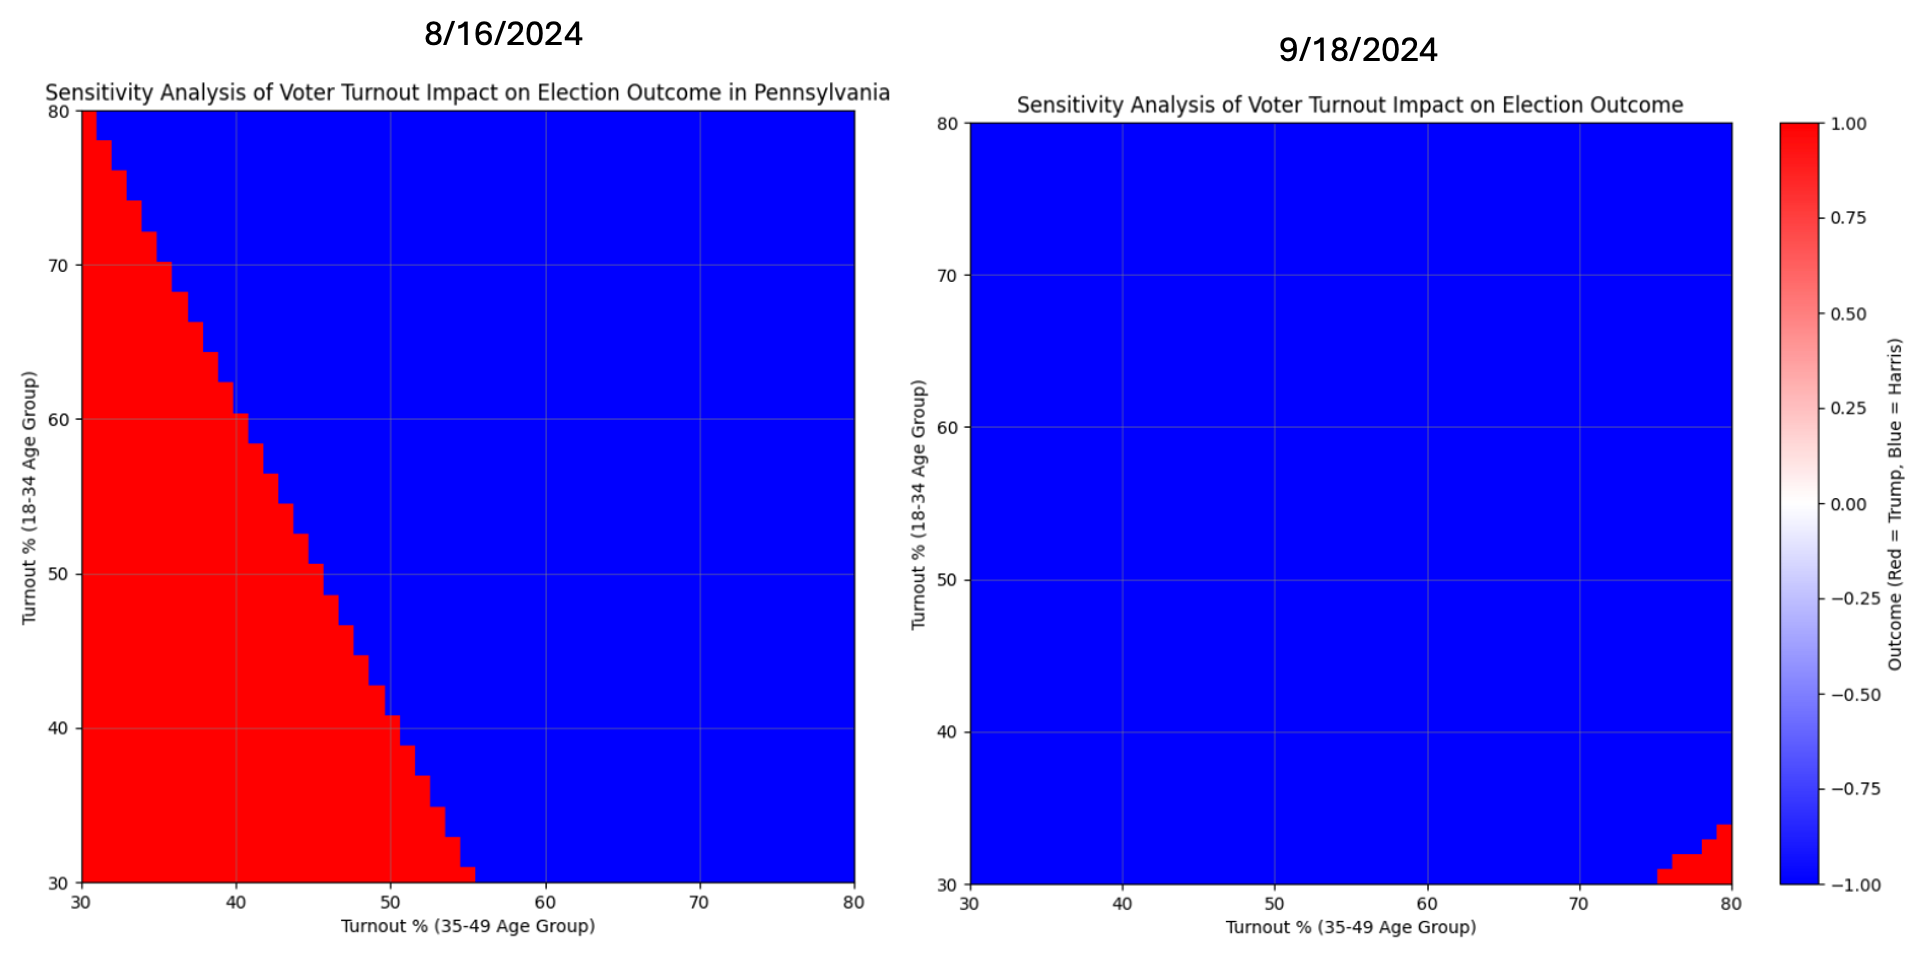
A sensitivity analysis was carried out by iterating through possible turnout scenarios, calculating total votes for Harris and Trump, and determining the election outcome (Harris or Trump) for each scenario, with blue representing a win for Harris and red for Trump. I also calculated the differences in votes between them two.
If voter sentiment holds under the latest Quinnipiac Poll, then under almost every scenario, Harris would lead Pennsylvania, even with low voter turnout. In fact, this trend holds steadily through a wide range of voter turnout across the 50+ age groups (50-100%).

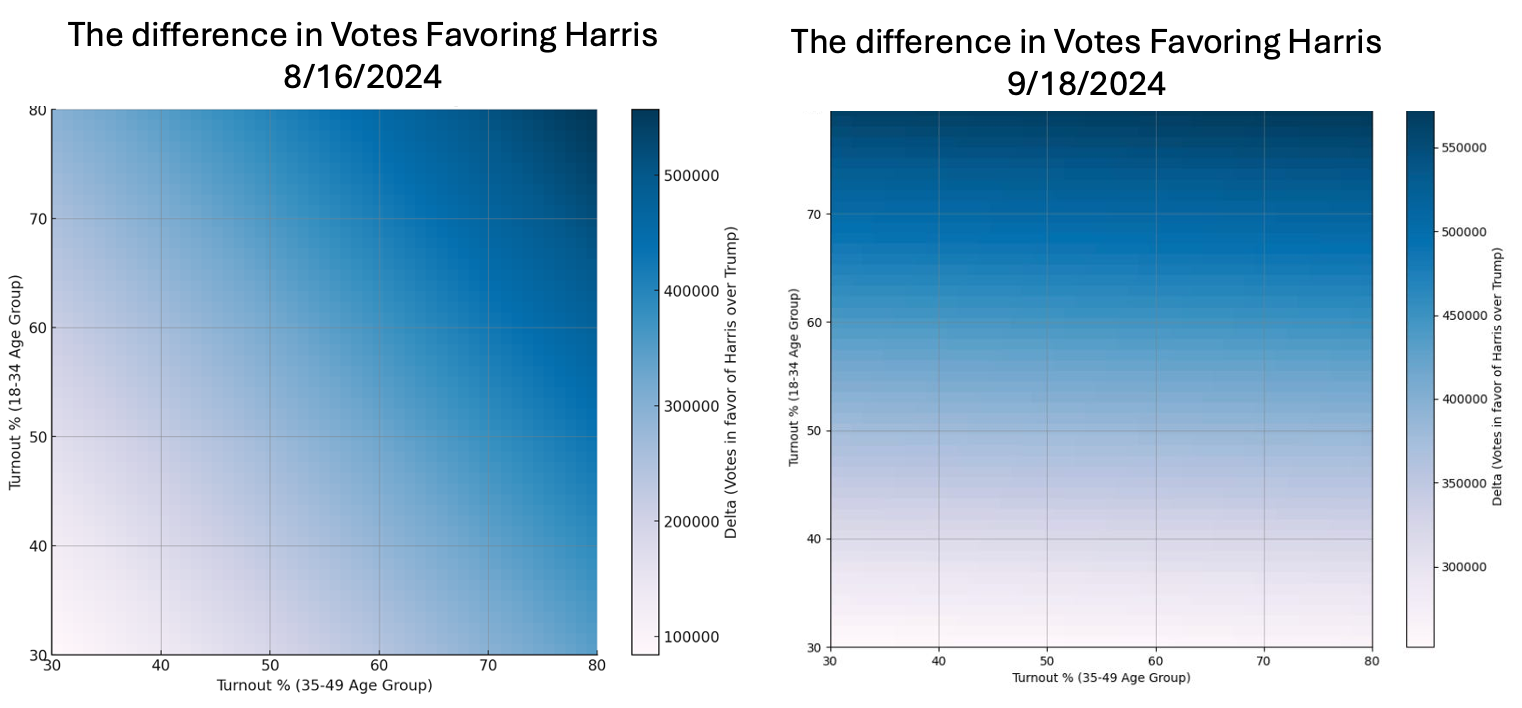
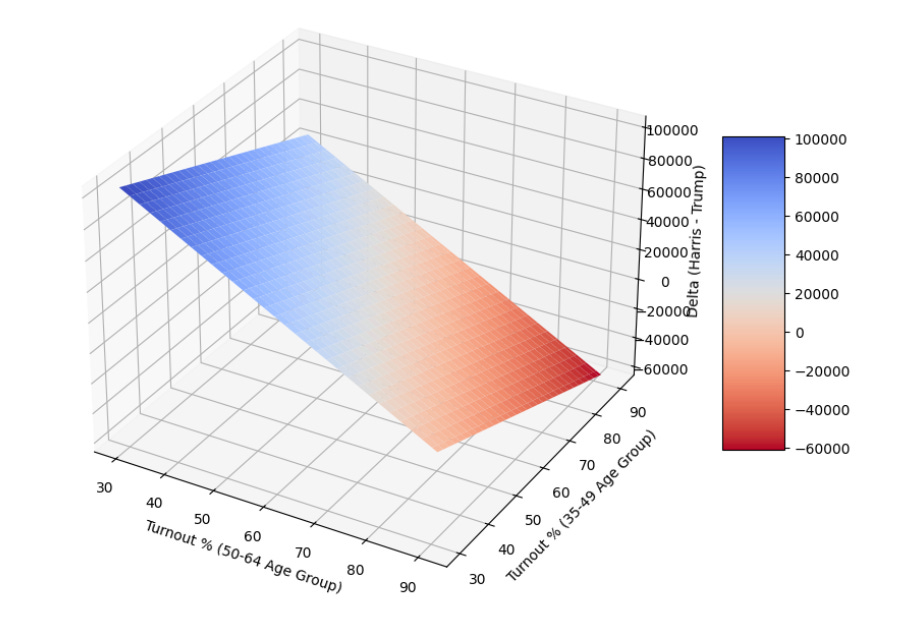
The heatmap above uses a blue-to-purple color scheme to represent the delta (difference) in votes in favor of Kamala Harris over Donald Trump based on varying voter turnout percentages among the 18-34 and 35-49 age groups. The color gradient moves from light purple (indicating a smaller vote difference) to dark blue (indicating a larger vote difference in favor of Harris). As one moves up and right, voter turnout of those ages 18-49 increases, and so do the number of votes in her favor.
What is most interesting, however, is the shift in this analysis since mid-August. The increase in support for Kamala Harris amongst older voters has made it such that she is now less sensitive to fluctuations in voter turnout across younger cohorts, specifically in those ages 35-49. In a nutshell, she has a wide advantage regardless of how many of these voters show up (at least in the 30-80% range).
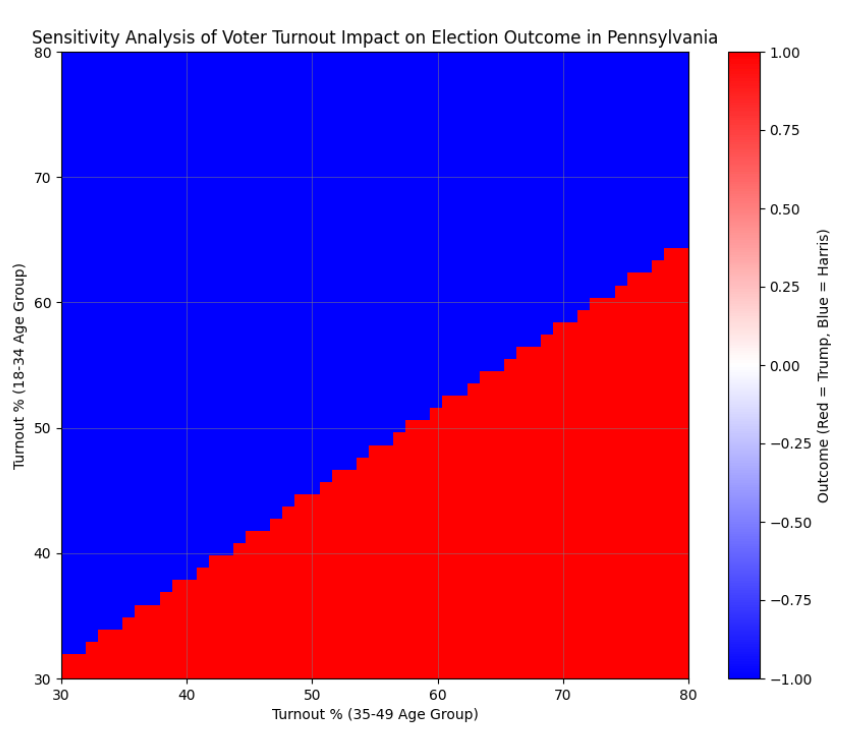
Now, because polls are NOT precise, it is more important to look at what could happen if voter opinion is vastly different than what is captured by the poll at a specific time point. In one scenario I diminish support for Harris by 5% amongst younger voters (<50) and increase it by the same amount for Trump for the September 18 poll.

The results reveal that Harris maintains a lead in most instances. Turnout would have to be both abysmal (< 33%) across 18-34-year-olds and over 75% across 35-49-year-olds for Trump to win (if we assume voter sentiment is correct). This outcome is driven by the overwhelming amount of support across those ages 65 and over in PA for Harris, who have a very high turnout.
Since the August 16 Quinnipiac survey, more older voters have tilted in favor of Harris (it was 50% Harris to 47% Trump back then for 65+). This is vastly different from the same scenario a month ago, where less support amongst older voters made Harris more sensitive to voter turnout across youth voters under 50, as depicted below. In fact, even if we drop turnout across older voters, say by 10% (down to 62%), the analysis shows Harris would have a strong lead despite lower turnout across youth voters. This is a pretty incredible shift in her favor. In all, the strong shift in voter attitudes across older voters in the last month has favored Harris immensely, with her becoming less sensitive to voter turnout in youth voters.
In all, the strong shift in voter attitudes across older voters in the last month has favored Harris immensely, with her becoming less sensitive to voter turnout in youth voters.
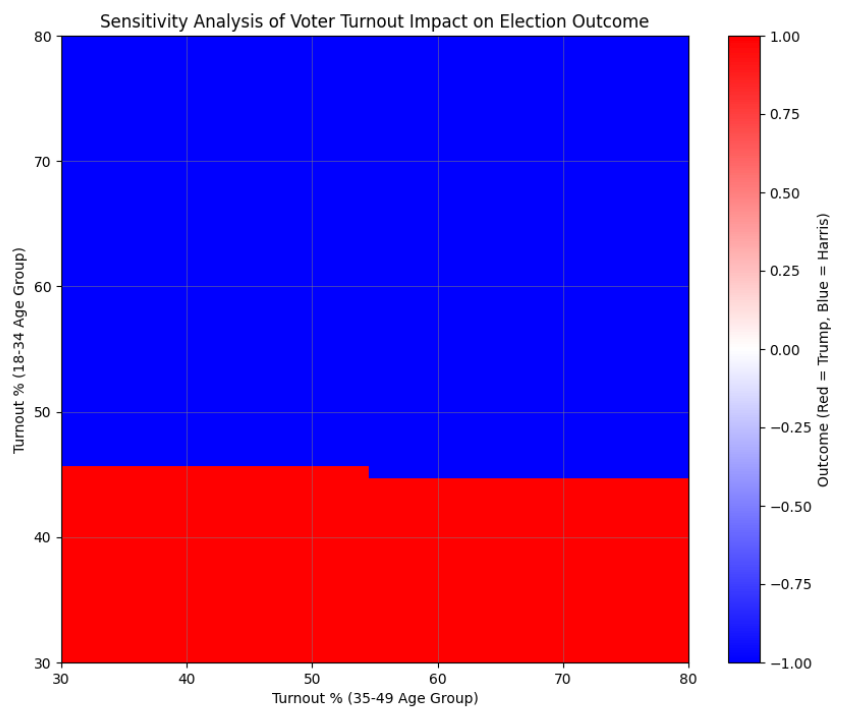
What happens if we increase support for Trump and decrease support for Kamala by the same percentage points across the older demographics (50+), say by 5%? This scenario is likely, as younger favors typically favor left-leaning or Democratic nominees more, and last-minute changes in voter sentiment can happen. The result is quite telling. Harris will lead as long as the youth vote turnout for those ages 18-34 remains above 46%.
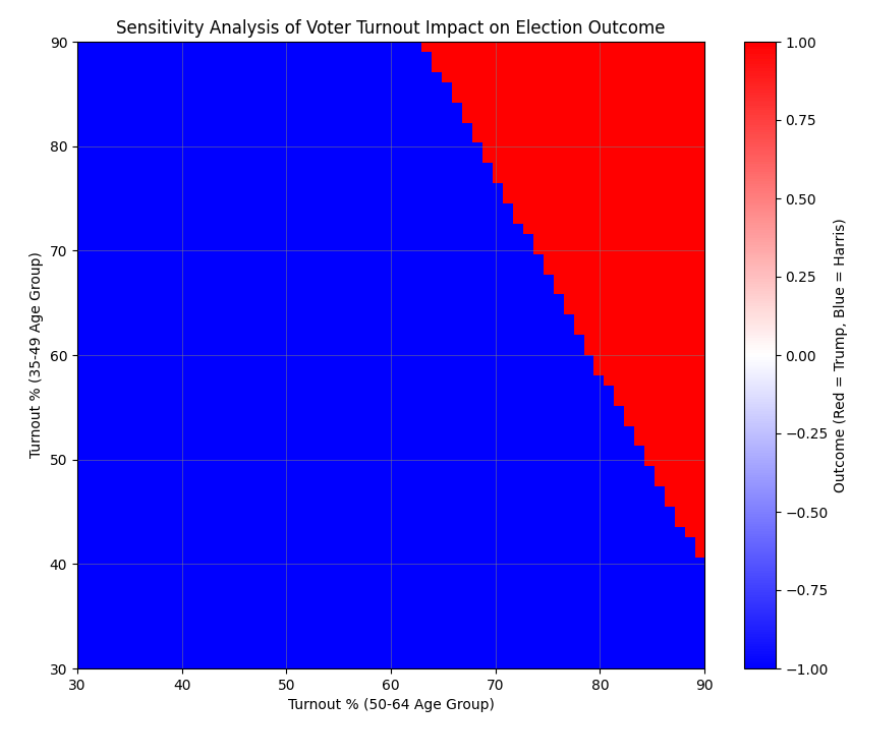
From the polls, we can see that the most volatile voter sentiment is the age group 35-49. Assuming 52% and 72% of votes ages 18-34 and over 65, respectively, show up, we can run sensitivity analyses of turnout across 35-49 and 50-64-year-olds. Doing so shows Harris carries a lead regardless of turnout (up to 90%). To see an effect, voter sentiment would have to dramatically change across youth 18-34 and those 65+. So let’s do just that.
In this scenario, I have increased support for Trump by 6% and reduced it for Harris by the same amount across 18-34 and 65+ age groups (so 53:43 and 47:50, respectively) - this is well outside the margin of error. In this scenario, we now see that Harris is sensitive to voter turnout in the mid-age demographic, but it took a whole 6% points in each direction for this to happen (all iterations under that still yielded for Harris), well outside the margin of error of the Quinnipiac poll. This is good news.

A more conservative voter preference, what then?
If we were to trust that poll results from the Washington Post more accurately capture voter sentiment, we would end up with a completely different analysis. We can impute the data above to get the following levels of support across the age groups:
Ages 18-34: 50% Harris and 45% Trump
Ages 35-49: 46% Harris, and 50% Trump
Ages 50-64: 45% for Harris and 52% for Trump
Ages 65 and over: 51% Harris and 45% Trump.
As we can observe, the poll above reflects a more moderate sentiment across youth voters in favor of Trump. It closely resembles the Quinnipiac poll for the voter sentiment across the 50+ demographic.
Assuming voter turnout across the 50+ demographic remains at or around 72%, our sensitivity analysis projects a Trump win unless youth ages 18-34 increase their turnout to levels roughly above 56% (turnout for 35-49 is likely to fall around 65%). Trump's chances increase if voters over 65+ decrease their participation. In such scenarios, the youth vote turnout for 18-34-year-olds would have to exceed 66% to guarantee Harris a win. This sharply contrasts our analyses above with the Quinnipiac poll, where Harris remained largely insensitive to turnout.

Under the more conservative Washington Post poll assumptions, if voter turnout for those ages 18-34 (52%) and ages 65+(72%) remains unchanged, then Trump has a good chance of winning if the turnout for those aged 35-49 and 50-64 exceeds 65-70% (a likely scenario for these age groups)

But if youth ages 18-34 turnout by 62% (a 10% increase), we see a significant shift in favor of Harris. More voters aged 35-49 and 50-64 would have to turn out to give Trump a win.
If sentiment were to shift across all age groups the state would lean more for Trump, but that is not what polls or data indicate. What about close calls?
Shifting Voter Sentiment
Again we can do a sensitivity analysis of polling data (we will start with Quinnipiac), fixing voter turnout to that of 2020 (see figure above) and changing voter sentiment for those ages 18-34 and 35-49. The plots model a scenario where support for one candidate (either Harris or Trump) is increased or decreased by a given percentage in one or both of the younger age groups (18-34 and 35-49).
If you move right along the X-axis, you're modeling a scenario where Harris gains more support (and Trump loses an equivalent amount) in the 35-49 age group.
If you move up along the Y-axis, you're modeling a scenario where Harris gains more support (and Trump loses an equivalent amount) in the 18-34 age group.
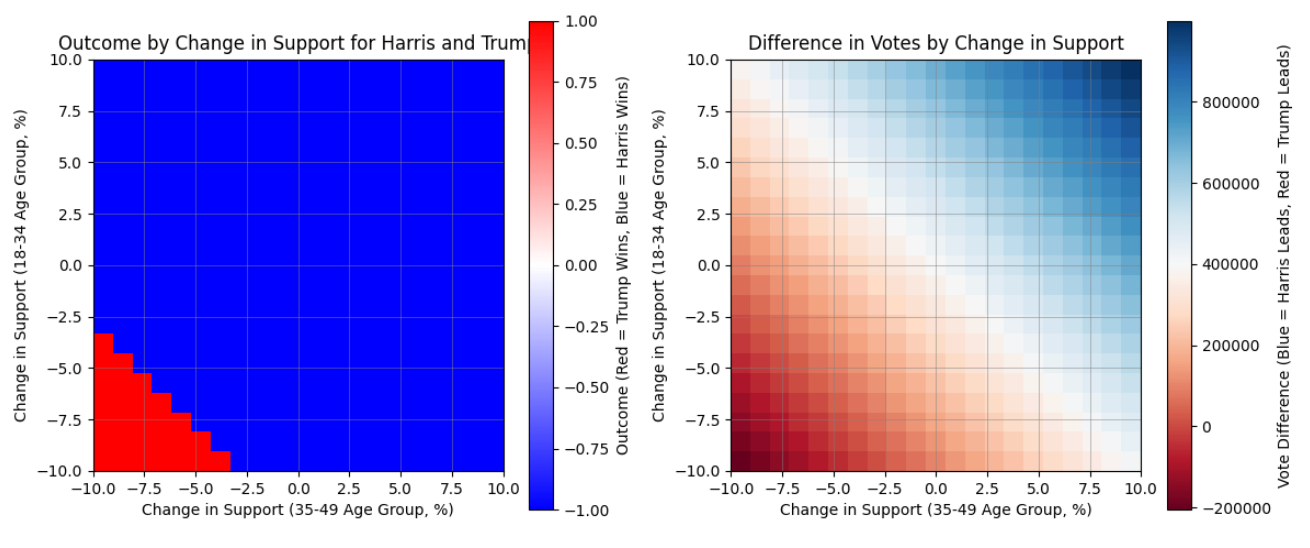
As observed, as support for Harris increases (moving right and up), the plot becomes predominantly blue, showing that Harris is more likely to win with increased support in both younger age groups. However, if attitudes shift towards Trump and voter turnout remains unchanged, there are scenarios where Trump would lead. These scenarios are less likely as they would require huge changes in voter preferences across youth (they would reside outside of the margin of error of the polls).
We can also measure the actual vote difference between the candidates under each scenario. Blue means Harris leads; red means Trump leads. The intensity of the color indicates the size of the lead.
What happens if we do the same for the older age groups, leaving sentiment fixed for the younger voters? That is, we analyze changing voter sentiment, or the imprecision of the poll across these groups ages 50 and over. Now we see that for the same voter turnout as in 2020, Harris’ lead becomes somewhat more sensitive to changes in voter preferences (the red area expands). However, once again it would require huge changes in voter preferences well outside of the margin of error of the polls.

Now, if we reduce the youth voter turnout (age 18-49) by 10% to 42% for those ages 18-34 and 55% for those ages 35-49%, we see that even if voting attitudes shifted slightly in favor of Harris amongst older age groups, there are scenarios, though unlikely, where she could still lose the election.
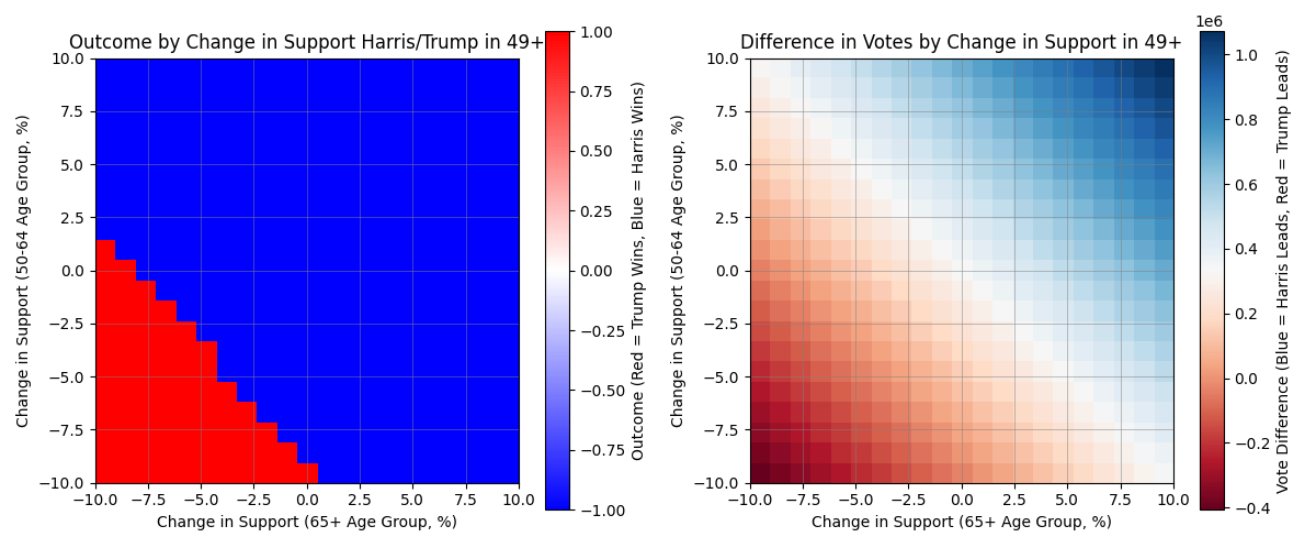
Now, what about the scenario where we increase support for Trump among older voters by 3% and reduce it for Harris by the same amount? How would shifting voter attitudes among younger voters impact outcomes? We now see that for Harris to win, voter attitudes have to be roughly within a margin of error of 2-3% across both youth groups. Anything greater may result in a Trump win if we assume voter turnout remains unchanged relative to 2020…

And ladies and gentlemen, this is why polls alone are so unreliable to predict election outcomes.
We can, of course, repeat voter preference analysis with pollster data from the Washington Post. If we believe that pollster data to be correct, then Harris wouldn’t have any legroom across youth voters, meaning any loss of support, regardless of how small, would result in a Trump win. This is quite insensitive to varying levels of voter turnout (unless we have a scenario where 18-34 turnout increases considerably relative to everyone else).