

Did a recent study demonstrate that maternal mortality is much lower than reported, and has remained relatively unchanged since the early 2000’s? AbsoFUCKINGlutely NOT.
Did a recent study demonstrate that maternal mortality is much lower than reported, and has remained relatively unchanged since the early 2000’s? AbsoFUCKINGlutely NOT.
The devil’s in the details…that were omitted: A case of data exclusion, an ecological fallacy, and improper comparisons. Bear with us.


Lately, headlines have been citing this study in the American Journal of Obstetrics and Gynecology to disseminate the idea that ‘Maternal Mortality Rates in the U.S. just aren’t the crisis” depicted by recent CDC data. This rests on a comparison of the maternal mortality rates for 2 different periods, 1999-2002 vs 2018-2021, using 2 distinct methods:
The National Vital Statistics System (NVSS) method, which relies on underlying cause of death codes and the pregnancy checkbox on death certificates. This showed a high and rising maternal mortality rate, increasing from 9.65 in 1999-2002 to 23.6 per 100,000 live births in 2018-2021.
An alternative definition-based method by the study authors, which ignored the pregnancy checkbox and required the mention of a pregnancy-related condition on the death certificate as one of the multiple causes of death, and excluded any deaths with underlying causes attributable to accidents, suicide, or assaults. This showed stable, lower maternal mortality rates of 10.2 in 1999-2002 and 10.4 per 100,000 live births in 2018-2021.
The authors argue that changes in how maternal mortality is tracked, such as relying solely on the pregnancy checkbox on death certificates for identification, have led to an overestimation of maternal deaths. For instance, a mother may have died due to underlying causes related to say, cancer or another condition, but if the pregnancy checkbox is utilized, her underlying cause of death may get a maternal death-related code. On the contrary, an approach based on specific criteria, requiring pregnancy to be listed among multiple causes of death, demonstrates lower and consistent maternal mortality rates in the United States. It also reveals a decline over time in deaths attributed to direct obstetric causes. Are they right?
TL;DR: The authors offer an alternative way of coding pregnancy-related deaths.They resort to ignoring the pregnancy box, and restricting maternal deaths to those that explicitly mention at least one pregnancy-related ICD chapter code (A34, O0-095, O98, O99) as one of multiple causes of death and don’t have an external underlying cause of death (accident, assault, injury, suicide). However, they do not demonstrate their method isn’t undercounting deaths either, which is exactly why the pregnancy checkbox was included in the first place. Although the implementation of the checkbox is imperfect, it was introduced to address the problem of undercounting deaths.
Rather, the findings raise a crucial issue about how to define pregnancy-related deaths. Upon replicating their methods I did find they are most certainly undercounting deaths, and also failing to show the year-by-year trends, which show a substantial increase, even by their methods. They resort to an ecological fallacy, showing aggregate data but not disclosing the steep increase in maternal mortality observed between 2018 and 2021, partly driven by the Covid-19 pandemic.
Lastly, the authors compare CDC data from 1999-2002 (9.65 per 100K live births) to 2018-2021(23.6 per 100K live births) which is inappropriate, as the pregnancy checkbox wasn’t implemented until 2003. The CDC has warned against doing this, because implementation of the pregnancy checkbox across all states didn’t happen until 2018 and observed changes in the rate between the time periods in part reflect the increasing number of states adopting the checkbox.
While one can agree that dying from a cause unrelated to pregnancy shouldn't automatically be classified as maternal mortality, conditions like postpartum suicide that may result from hormonal shifts aren’t included at all (in either method). Should they be? It’s a nuanced consideration. What about conditions that get exacerbated by the pregnancy, resulting in a death shortly after giving birth but aren’t coded correctly to fit their criteria? It is a bit of a gray area. Furthermore, racial disparities persist despite the alternative definition, and we hope this becomes a more prominent focus of ongoing discussions about maternal mortality
.What is maternal mortality?
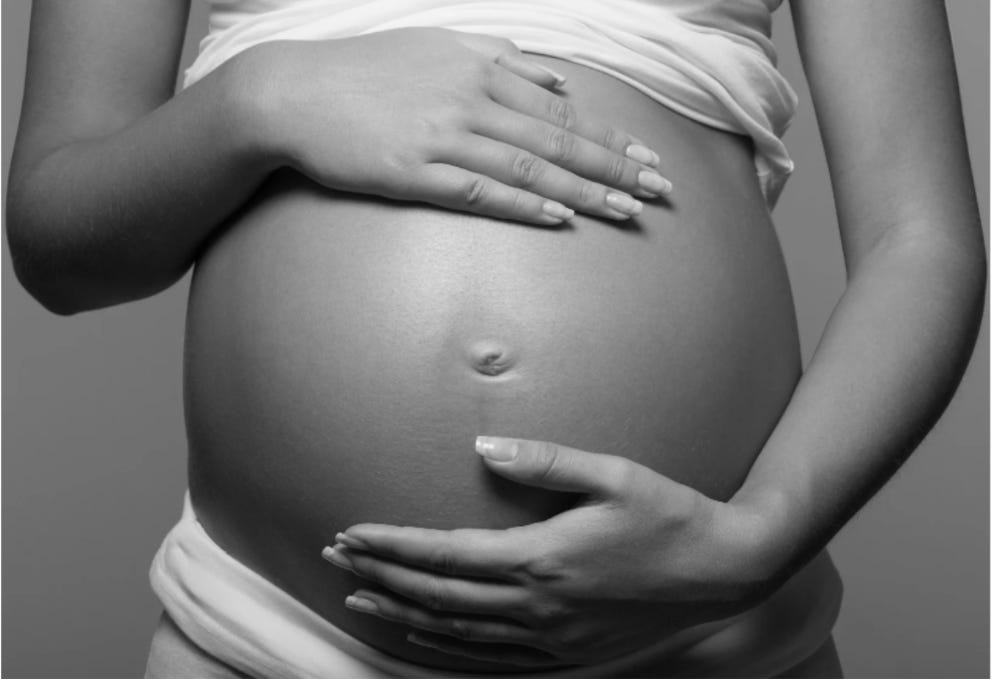
Let’s start with a few definitions. For purposes of this study, maternal mortality refers to the death of a woman during pregnancy or within 42 days after the end of pregnancy, from any cause related to or worsened by the pregnancy or its management, but not from accidental or incidental causes. Within maternal deaths there are 2 subcategories:
Direct obstetric death is a type of maternal death resulting directly from complications of pregnancy, childbirth, and the postpartum period, or interventions, lack of proper care, incorrect treatment, or a sequence of events stemming from any of these factors.
Indirect obstetric death is a maternal death resulting from a pre-existing disease or a condition that developed during pregnancy, which was not directly caused by obstetric factors but was aggravated by the physiological effects of pregnancy.
Late maternal death refers to the death of a woman from direct or indirect obstetric causes occurring more than 42 days but less than one year after the end of pregnancy.
Incidental cause of death is unrelated to and unaffected by pregnancy and its management, such as breast cancer that was not impacted by the pregnancy.
Accidental cause of death results from trauma due to an accident, including transportation incidents, other accidents, self-harm, or assault, and is not influenced by the pregnant state.
Pregnancy-related death is defined by the WHO as the death of a woman while pregnant or within 42 days of pregnancy termination, regardless of the cause of death. The PMSS defines it as a death during pregnancy or within one year of the end of pregnancy from any cause related to or worsened by the pregnancy.
Pregnancy-associated death refers to a death that occurs during pregnancy or within one year of its end, regardless of the cause. In this study, maternal and late maternal deaths were excluded from pregnancy-associated deaths to ensure the categories were mutually exclusive.
The underlying cause of death is the disease or injury that initiated the sequence of events leading directly to death or the circumstances of the accident or violence that produced the fatal injury. It helps identify critical conditions and diseases that can be targeted by preventive health measures.
Multiple causes of death include all causes listed on the death certificate, such as the immediate, intermediate, and underlying causes, as well as contributory conditions.
How Maternal Deaths are Coded, and how this has changed through the years
In 2003 the CDC changed the way maternal mortality figures were recorded. Prior to that, these relied on causes of death in death certificates, but often overlooked pregnancy and led to underreporting. A study evaluating the period from 1995 to 1997 revealed that surveillance efforts identified 35 percent more maternal deaths compared to relying solely on death certificates. Several factors contributed to this underestimation, including incomplete information in the cause-of-death section, reliance on limited data sources, and variations in the process of identification.

The implementation of the ICD-10 (See Notes at the very end of the post) and updates to the U.S. Standard Certificate of Death in 1999 had significant implications for maternal mortality tracking. Notably, ICD-10 introduced new definitions for "Late maternal death" and "Pregnancy-related death," while it retained definitions for maternal, direct obstetric, and indirect obstetric deaths.
Additionally, expanded coding guidelines in the United States now classified deaths with indirect maternal causes, alongside reported pregnancies, as maternal deaths. If a death certificate reported only indirect maternal causes of death—such as a pre-existing disease or a condition that developed during pregnancy not directly related to obstetric causes but exacerbated by physiological effects of pregnancy—and pregnancy was indicated in either Part I or II, the death would be categorized as a maternal death. In contrast, under ICD-9, pregnancy had to be documented in Part I for a death from indirect causes to qualify as a maternal death.
The ICD-10 also introduced new categories and details in cause-of-death titles related to pregnancy, childbirth, and the postpartum period, including causes such as "Death from any obstetric cause occurring more than 42 days but less than one year after delivery" and "Death from sequelae of direct obstetric causes." Furthermore, the ICD recommended including separate questions about recent pregnancies on death certificates.
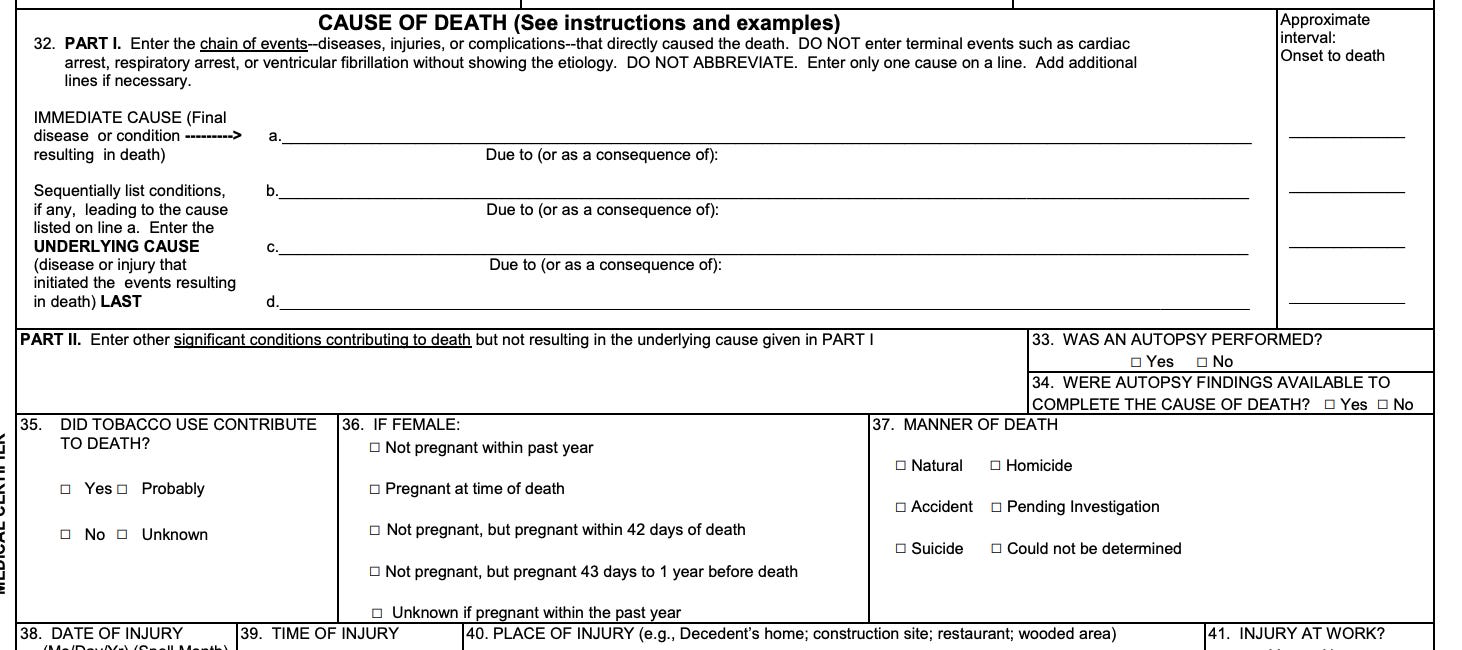
Consequently, the 2003 revision of the U.S. Standard Certificate of Death introduced a pregnancy checkbox in section 36:
The “false positive” problem for rare events
This check box, in turn, resulted in overreporting. Rossen et al. conducted a literature review on checkbox reporting errors and found false-positive rates, indicating pregnancy or recent pregnancy when the decedent was not pregnant, as high as 50%. An internal analysis by NCHS, linking hospital records with death certificates, suggested potential false positive rates of 54% and 56% for the checkbox in 2014 and 2016, respectively.
Davis et al. examined age-related patterns and also pointed to misclassification with increasing age. Follow-up research supported the idea that false positives from checkbox errors were more common among women in their 40s and 50s. Analysis across four states (Georgia, Louisiana, Michigan, and Ohio) revealed that pregnancies indicated by the checkbox for individuals under 40 were more likely to be confirmed. Conversely, pregnancies for those aged 45 and over were less likely to be confirmed. For instance, only 19% of deceased individuals aged 45–49 with a positive checkbox response (indicating pregnancy or recent pregnancy) had evidence of an actual pregnancy.
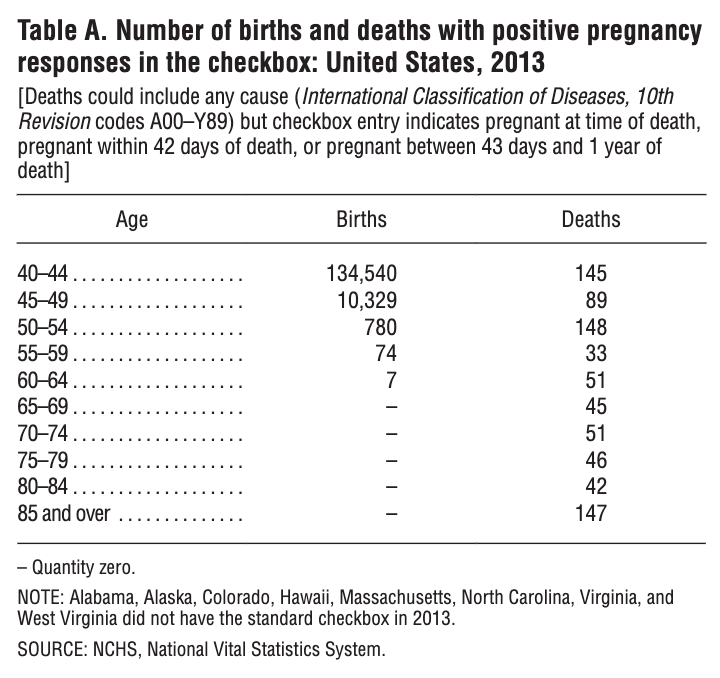
The false-positivity rate was so high that NVSS mortality data for 2013 (excluding certain states) showed that 797 deaths of women aged 40 and over had a checkbox entry indicating pregnancy at the time of death or within the last year, with 652 of these pregnancies reported among those aged 45 and over, and 147 reported among those over 85. The number of reported pregnancies in older age groups was unrealistically high, with the number of maternal deaths in women ages 60-64 even surpassing the reported number of women giving birth.
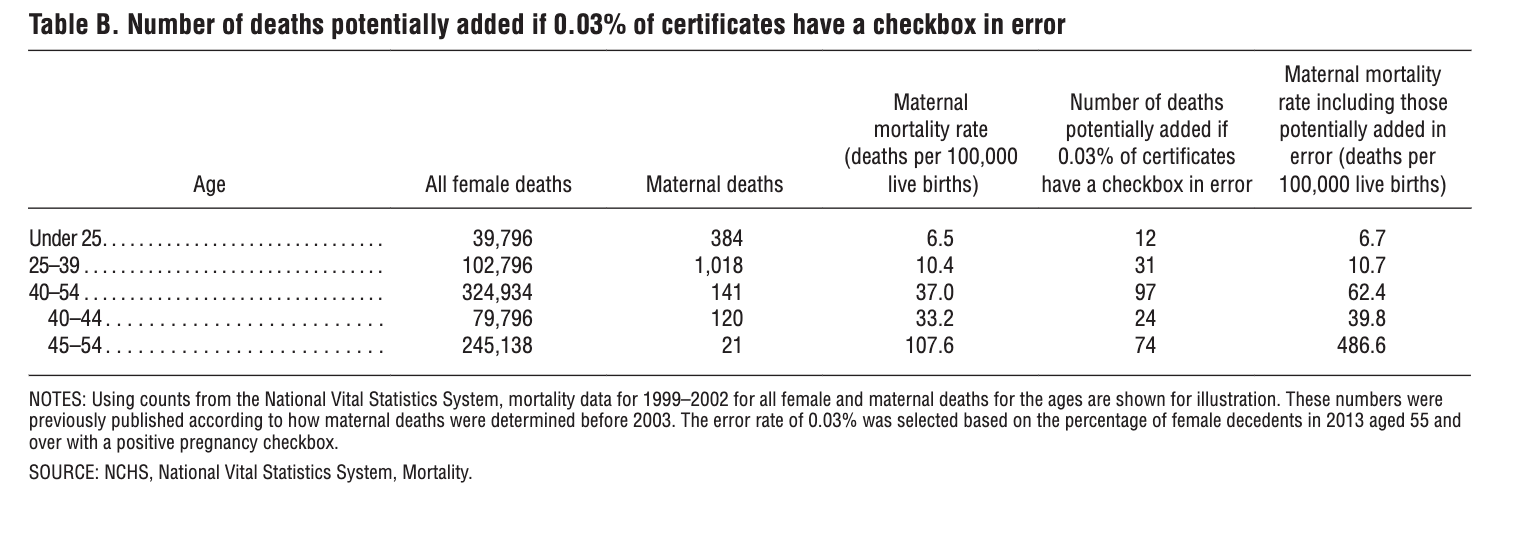
To illustrate the impact of this, data from before the checkbox was used with a hypothetical constant error rate of 0.03%. Not only does it increase the numbers of deaths by several hundreds, it also shows that the number of potential errors introduced by the checkbox increases with age. This makes sense as the number of live births decreases dramatically with age, making the denominator smaller and increasing the overall rate.
We call this the false positive problem of rare events, and I have discussed this before here. When attempting to measure the occurrence of a rare event, one has to be especially careful about misclassification (i.e., calling something that is false true, or calling something that is true false). Random misclassification can result in significant overestimation, even when the actual rate of misclassification is low.
New Methods, New Data
As a result, in 2018 the CDC implemented a new method with 2 major changes (referred to as the 2018 method) for coding maternal deaths to mitigate the effect of false positives. First, the age range for applying the checkbox item was narrowed to individuals aged 10–44, excluding those aged 45 and over.
Second, the method for reporting causes of death for maternal deaths was revised. Previously, all medical conditions listed on the death certificate were assigned maternal codes if the checkbox indicated pregnancy within the past year, leading to loss of detail and difficulty in identifying potential errors in checkbox-only cases. With the 2018 coding method, only the underlying cause of death is coded to a maternal code if the checkbox is the sole indicator of pregnancy, preserving most of the original detail and ensuring better reflection of what was reported on the death certificate. Additionally, checkbox-only records will be flagged in the mortality files using this new format. It is important to note that it wasn’t until 2018 that all states had implemented the pregnancy checkbox.
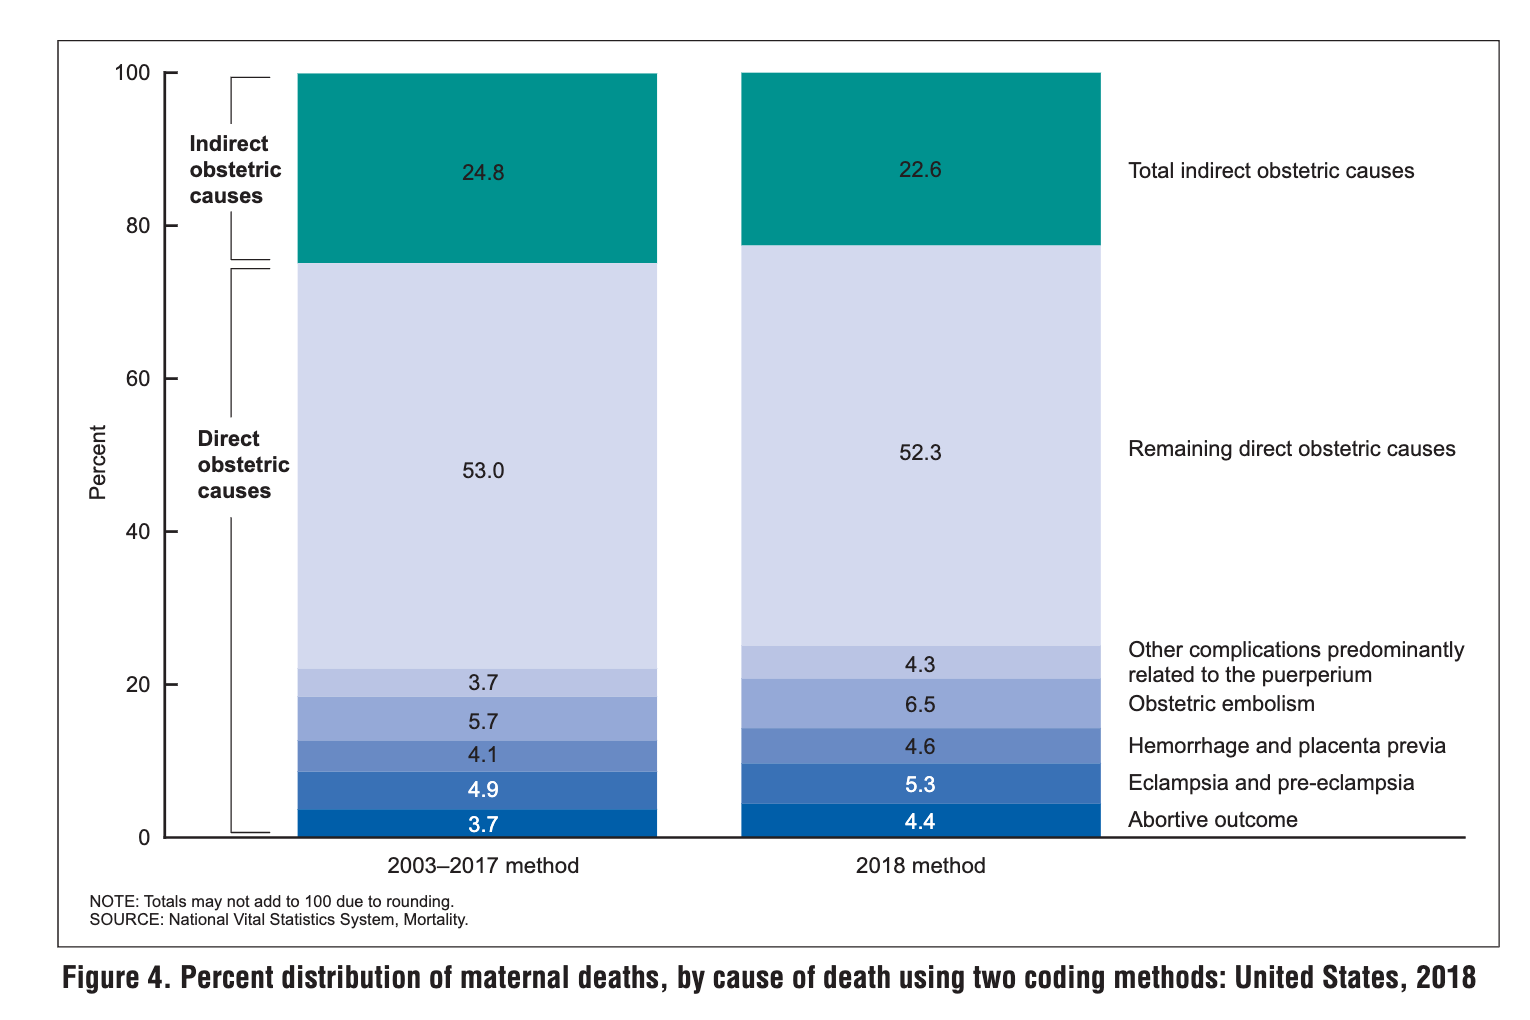
Despite the methodological differences, the distribution of causes of death remained similar. In 2018, the maternal mortality rate for indirect obstetric causes was 5.1 deaths per 100,000 live births with the 2003–2017 method, decreasing to 3.9 with the 2018 method. Similarly, the rate for direct obstetric causes decreased from 15.4 to 13.4 deaths per 100,000 live births. Rates for specific direct causes also showed slight decreases with the new method. Additionally, maternal mortality rates increased with age for all causes of death regardless of the coding method used.
This unreliability of the 2003-2017 data due to overreporting and the gradual implementation of the checkbox across states explains why the authors restricted their comparisons to 1999–2002 vs 2018–2021, excluding data from 2003 to 2017.
However, it also means that a comparison between the 1999-2002 (before checkbox) and the 2018-2021 time periods, as the authors have done here, is comparing data sets with different inclusion/exclusion criteria and may not be directly comparable or appropriate (although that’s not the worst of it). The CDC made changes to the way that maternal mortality figures were reported in 2003 and then again in 2018, that effectively changed the reporting rates, particularly amongst older women.
The other reason that comparing maternal mortality rates for 2018 and beyond with previous years is not suitable is due to the gradual adoption of the checkbox by states over time. Changes in rates primarily reflect the increasing number of states adopting the checkbox rather than an actual change in maternal mortality risk.
The CDC explicitly states: “It is not appropriate to compare maternal mortality for 2018 with previous years when the checkbox had not been adopted by all states and the number of states adopting the checkbox increased each year. Observed changes in the rate reflect the increasing number of states adopting the checkbox rather than a change in the risk of maternal death.”
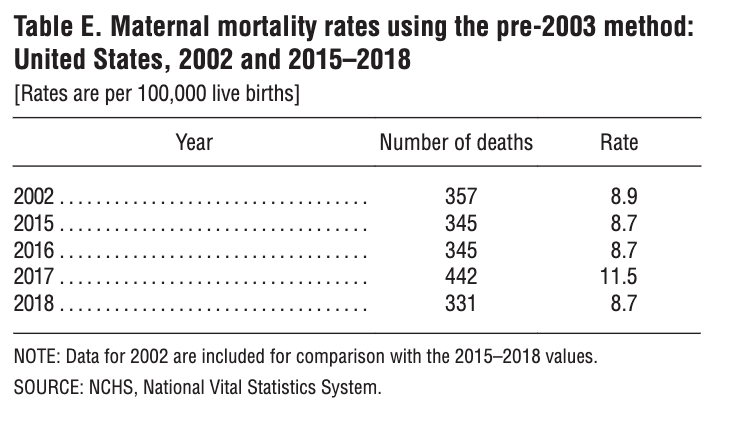
If maternal mortality rates were calculated without using the checkbox (referred to as the pre-2003 method) for 2015–2018 one would observe that rates for most years were not statistically different from 2002. These findings align with other reports indicating that maternal mortality rates did not significantly increase (with the exception in 2017) even after accounting for the staggered implementation of the checkbox or if the checkbox had never been implemented up until then.
Explaining the Discrepancy
If rates didn’t increase dramatically after the checkbox was introduced, then why did the 2021 CDC maternal mortality report using the new method find 2018 rates to be 17.8 per 100,000 live births though? This was vastly different from the rate using the pre-2003 method, twice as high. The takeaway from these two last pieces of information is that the pre-2003 method before the pregnancy checkbox was introduced, was likely undercounting deaths, and implementation of the checkbox offered a more accurate count
This was because without accounting for pregnancy, many underlying causes of deaths were not being adjusted to reflect that a pregnancy had led to them. For instance, if a woman died from a stroke caused by pregnancy but a pregnancy-related ICD code wasn’t listed in the causes of death, this death wouldn’t have been flagged as a maternal death (pre-2003 without the checkbox). By the same token, the pregnancy checkbox may contribute to overcounting some deaths. However, the extent of it is not settled by this study and the numbers that the authors arrive at are at best closer to a lower bound, quite similar to the rates reported pre-2003. Let’s see why.
Replicating the methods, and answering more questions in the process
For us to understand the limitations of the methods implemented by the authors and the implications of these in the overall analysis, it is important that we replicate their methods. While I (Nini) first tried obtaining the data via CDC Wonder, I found that while I could easily get the data for the CDC NVSS method here, using the underlying cause of death, the data wasn’t stratified enough to get the numbers the authors obtained for their alternative method. I had to download the raw data for the multiple causes of deaths for both the continental U.S. and its territories from here.
First, we must first understand how a death certificate is filled out and how checking the pregnancy box impacts it. The medical certifier fills out the death certificate form, providing details such as the decedent's name, date of birth, date of death, and place of death. The certifier lists the cause(s) of death in two sections:
Part I - Immediate Cause(s) of Death: This section includes the condition(s) directly leading to death, with the immediate cause listed first. The conditions leading to the immediate cause of death are listed sequentially (see Part I, b, c, d), with the underlying cause of death, the disease or injury that initiated the events resulting in death, listed last.
Part II - Other Significant Conditions Contributing to Death: This section includes any other significant conditions that contributed to the death but may not have directly caused it.

If the pregnancy checkbox is selected on a death certificate without a pregnancy-related cause of death listed in Part I or Part II, it indicates that the individual was pregnant at the time of death, but the pregnancy itself may have not directly contributed to the cause of death.
In such cases, the pregnancy checkbox serves to document the individual's pregnancy status at the time of death for public health and statistical purposes. It helps in tracking pregnancy-related deaths and understanding the impact of pregnancy on mortality, even if the pregnancy itself did not cause the death.
What about if the pregnancy did contribute to the other causes of death? Stay with us here and look at the examples below.
The records where a maternal code is listed as one of the causes of death and the pregnancy checkbox is selected are straightforward. This would be readily classified as a maternal death where the underlying cause of death is a maternal code listed on the multiple causes of death sections ('A34', 'O98', and 'O99', and ranges from 'O00' to 'O95'). The record and entity axis codes (parts of the certificate whe causes of death are recorded) would be coded the same for both the 2003-2017 and the 2018 methods.
For records where only the checkbox indicating pregnancy is selected (but no maternal codes are listed in the multiple causes of death), not all conditions listed on the record will be assigned maternal codes, as was previously practiced. Instead, only the underlying cause will be adjusted. The entity axis fields (see example below) will remain unchanged. In the record axis field (see example below), the non-maternal code that would have been selected as the underlying cause if no checkbox item had been available, will be flagged with a 1 in the fifth position of the field. For individuals aged 45–54 with a positive pregnancy checkbox but no reported pregnancy-related information in the cause-of-death section, the underlying cause and multiple-cause fields will reflect coding performed without utilizing the checkbox item.
An example is illustrated below of i) a case with a pregnancy checkbox and mention of pregnancy or obstetric condition in the cause of death, and ii) a case for a decedent age 10-44 with a checkbox-only record.
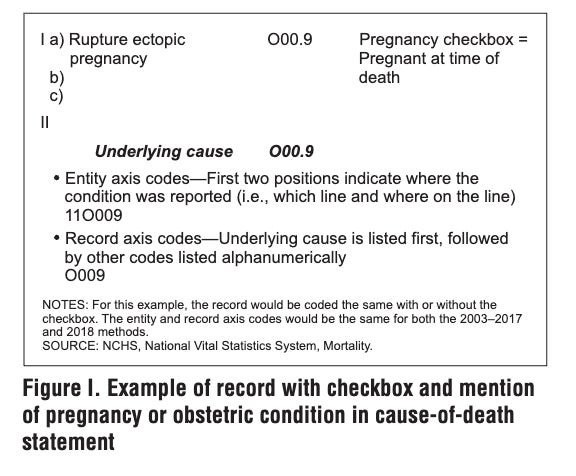

Notice in the example above that while the entity axis lists the multiple causes of death that are not coded as maternal ICD-chapter codes, the record axis does include an adjusted underlying cause of death code in the first position (O994), based on the information provided by the certifier and the fact that the decedent was pregnant. In the example above, it is likely that the pregnancy initiated or aggravated the conditions listed under multiple causes of death. There is also a small chance they were unrelated, which is what the authors claim is over inflating counts.
One of the oldest tactics in the book: exclusion.
To address this, the authors only look at the entity axis codes, not the record axis for the ICD-chapter codes related to complications from pregnancy. In the latter, the underlying cause of death is adjusted if the pregnancy checkbox is selected. In the author’s alternative method, the death is only classified as a maternal death if a pregnancy-related ICD code is listed in the entity axis, ignoring the pregnancy checkbox by ignoring the record axis, where an adjustment might have been made to reflect a pregnancy-related underlying cause.
One can already see in looking at the entity-axis field of the example above how ignoring the pregnancy checkbox (and consequently, the record axis) might result in undercounting. While it is completely within reason that the pregnancy did not contribute to the demise of the decedent, one cannot just assume that is entirely true by excluding the record axis all together, where the adjustment would have been made. These adjustments are made on a case-by-case basis, using all the information available about the decedent by their medical provider.
If we look at the data, we can see that not every death certificate that had the pregnancy checkbox selected was adjusted as a maternal death with the NVSS (CDC) method, meaning that these death certificates were reviewed with the certifier’s judgment to determine whether the death resulted from a maternal complication or not. The pregnancy checkbox is usually flagged as a “1” on the fifth position of the second condition listed in the record axis, so it is easy to look up how many death certificates had the box checked. We also see that about 3/5 of the deaths flagged as maternal deaths using the NVSS method had a pregnancy checkbox selected. This means that close to 40% of the deaths were deemed as maternal deaths despite not even having the checkbox selected. In the supplement (page 40) the authors note that 2015 of the deaths flagged by the CDC used the pregnancy checkbox, whereas we obtained 2016.
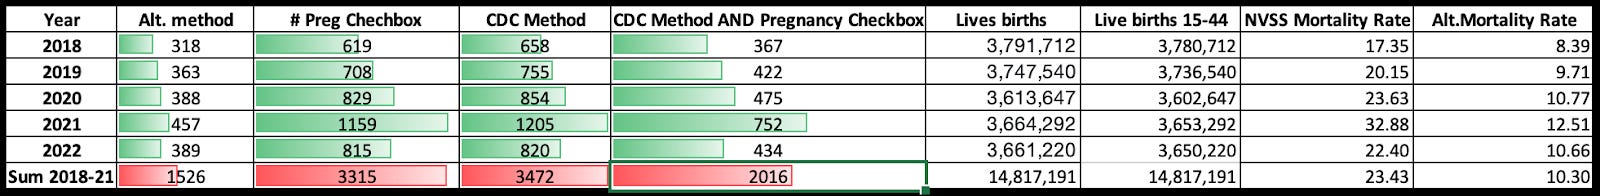
Looking at just the entity-access disregards the certifier’s judgment about what led to the cause of death. This methodology at best likely represents something closer to a lower bound of the number of maternal deaths. The numbers the authors must have arrived at for 2018 (8.4 deaths per 100k live births), for instance, are very close to the numbers obtained by the CDC (8.7) using the pre-2003 method for that year. So the authors’ alternative method is just closer to the pre-2003 method, which we already know wasn’t very accurate to begin with - it was undercounting.

The Ecological Fallacy: Showing an Average to Wash out Increasing Trends
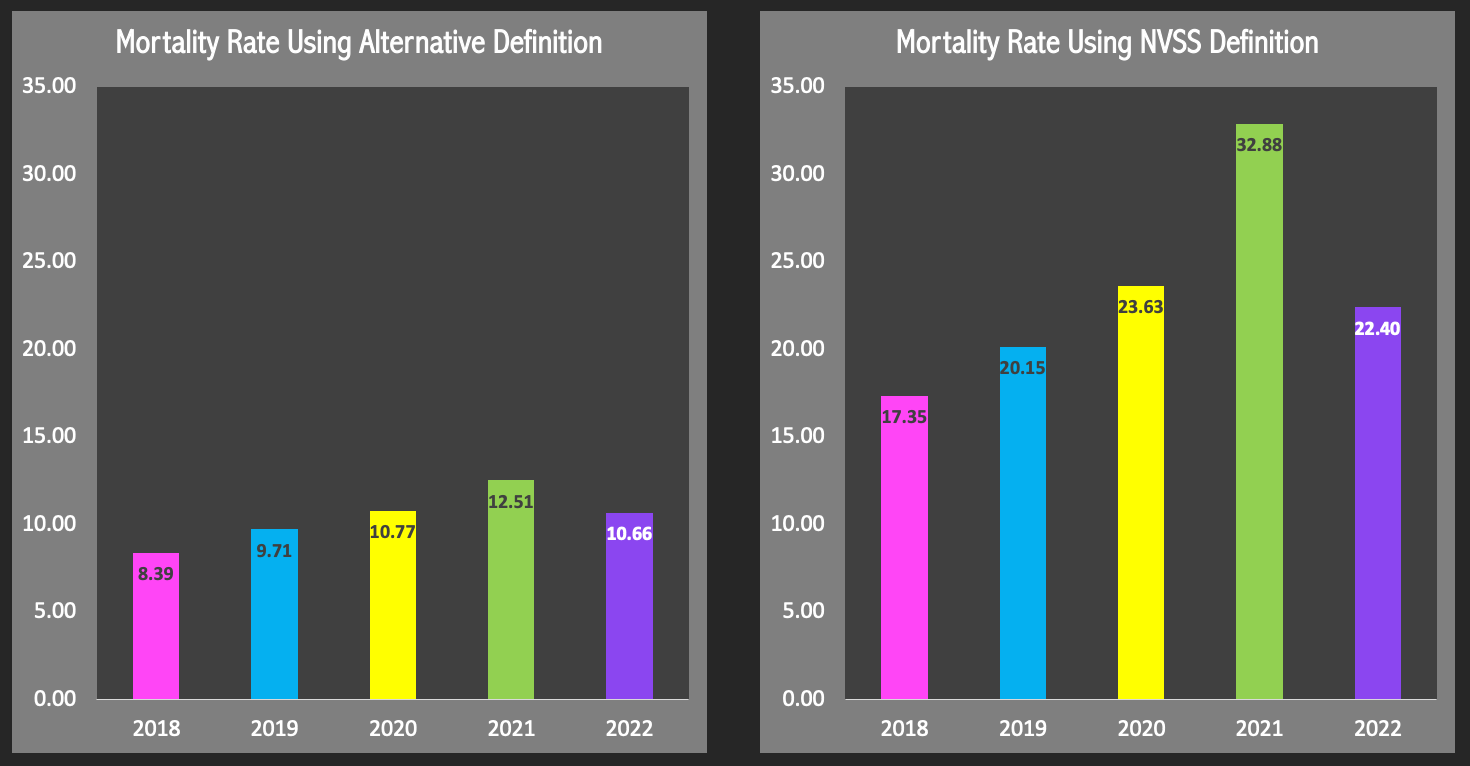
Something else stands out from the data above. The authors keep presenting data as an aggregate for the periods 1999-2000 and 2018-2021. We found this particularly odd, as one would typically present year-by-year data. As a COVID-19 science and risk communicator and maternal-fetal medicine ObGYN, we are acutely aware of the impact of the pandemic on pregnant women in the US. Therefore, we anticipated a spike in numbers for the years 2020-2021. Although the authors mention COVID-19-related deaths, they present the mortality rate as an average, suggesting stability compared to the 1999-2002 period.
Indeed, what we see in replicating their methods is that between 2018 and 2021 the number of maternal deaths rose quite a bit, regardless of the method implemented. When we adjust by the total number of live births each year, we see the rates increasing from roughly 8.4 per 100,000 live births in 2018 to 12.5 in 2021 with their alternative definition. That’s not an insignificant increase and it got omitted from the study entirely, failing to reflect the magnitude the pandemic had on pregnant women’s outcomes. The script written for this analysis identified 1526 of the 1537 deaths identified by the authors, so the aggregate rate obtained was subtly lower, 10.3 instead of 10.4 per 100,000 for the 4-year period. 2022 data was readily available for download and was added, since the scripts were written already (will also be using these for 2023 and 2024 data). We see the mortality rate drop in 2022, as the effects of the pandemic eased on pregnant people.
Outside of improperly comparing time periods with different coding criteria (comparing CDC NVSS methods from 2018-2021 to 1999-2002) and completely disregarding the adjustment made by the pregnancy checkbox, the authors wash out important year-by-year trends that show a marked increase in maternal mortality by presenting an average, all while claiming rates are stable relative to 1999-2002 when they really were not. At a time when women’s lives are literally at risk due to restrictions to access to reproductive care, this type of assessment risks further endangering women’s lives, by diminishing maternal mortality rate and the increase in recent years.
Maternal Mortality is STILL high and Disparities Remain
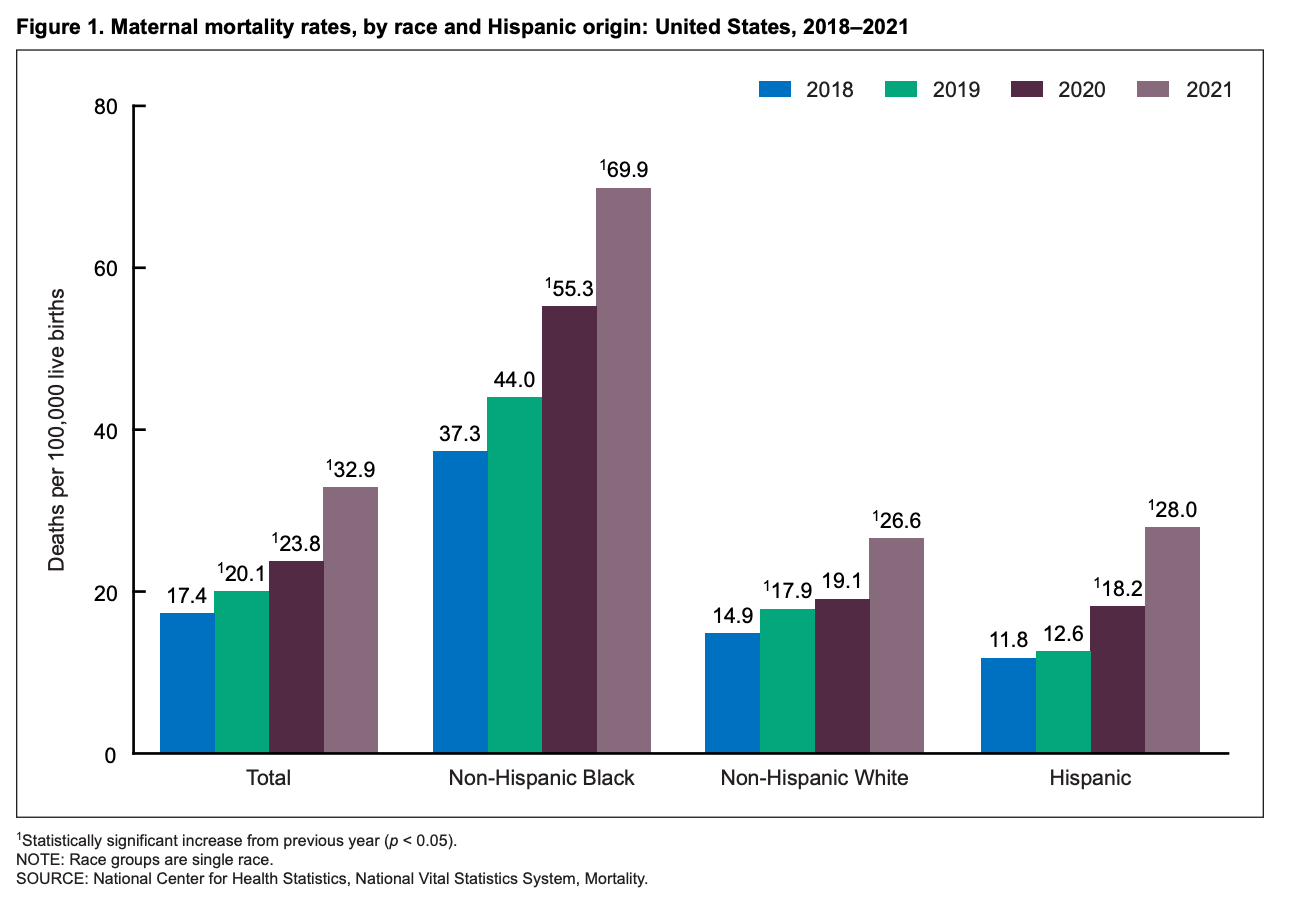
Maternal mortality in the US is still high. More importantly, the disparities across non-Hispanic black women and their white counterparts are staggering, regardless of the method implemented. The authors do make mention of this and are also able to show this.
Their alternative method also showed a 17% decrease in direct obstetric deaths but a 46% increase in indirect obstetric deaths. Specifically, deaths from preeclampsia, embolism, and hemorrhage decreased, while increases in deaths from placental disorders, cardiomyopathy, and preexisting hypertension were noted.
However, the assertion that the alternative definition-based method provides a more accurate picture of maternal mortality in the U.S. compared to the NVSS method relying on the pregnancy checkbox is blatantly egregious. This study does not settle that.
Limitations
While this analysis was able to largely replicate the authors' methods and findings based on the data and code descriptions provided, it's possible there are some minor discrepancies or gaps compared to exactly what the authors did.
Furthermore, this analysis is also unable to determine "true" maternal deaths at the individual level, meaning this data alone can't definitively determine if the pregnancy did or did not contribute to an individual's death. Adjudicating that likely requires detailed case-by-case clinical review.
The authors' method likely undercounts maternal deaths to some degree compared to current CDC methods, but the precise extent of overcounting by those methods remains uncertain. The checkbox false positive rates are concerning but may vary over time.
Maternal mortality data often lags by 1-2 years, so while data for 2022 is included, the impact of very recent events, such as Dobbs, may not be captured yet.
Lastly, there is also some ecological bias in the interpretations, as one expects rates to vary dramatically by state, reflecting differences in the population, and most recently the impact of more restrictive abortion policies.
Show your work: Replicating the methods
So how did we replicate these results? Well, first we must download the records for the roughly 3 million people that die in the US every year, both for the continental U.S. and its territories. This is a lot of data. Death certificates recorded by the CDC include various pieces of demographic and medical information.
Imagine each of the records being coded with a string of letters and numbers that reflect age, race, where the death happened, causes of death, etc. Each row in the file represents a death and holds a string. Each position on the string, or as they call it, tape location, holds information in the death certificate, such as race, age, time of death, causes of death, underlying death, etc. The last two are listed using ICD codes.
For instance, the gender of the deceased is coded at the 69th position on each line: ‘M’ for male and ‘F’ for female. Age is recorded in a two-part format, with a code for the age type (e.g., days, months, years) at position 70 and the actual age at positions 71-73. The script specifically filters for female cases where the age type indicates years and the age falls between 15 and 44.
The script reads multiple medical codes related to the cause of death from two different sets of positions: one for the underlying cause (single code, tape location 146-149) and another for multiple contributing cause codes (entity axis, tape location 165-304). These codes are used to determine if a case meets specific inclusion or exclusion criteria related to obstetric conditions and certain types of accidents or external causes, based on the author’s and CDC’s definition.
In the supplement, the authors denote that they are specifically looking in the entity-axis for at least one pregnancy-related ICD chapter code. The entity axis is between tape locations 165 and 304, with each entity field being 7 characters long (the first 2 characters denote which line and where on the line as seen in the example above). It is here that the script scans for the inclusion criteria: Specific codes, primarily those starting with ‘O’ (indicating obstetric causes), are checked to identify cases of maternal deaths. The script looks for exact codes like 'A34', 'O98', and 'O99', and ranges from 'O00' to 'O95'.
The authors, like the CDC, exclude any deaths from external causes or accidents. The script scans the tape locations 146-149 to exclude cases with codes indicating accidents or external causes (codes starting with 'V', 'W', 'X', and specific ranges under 'Y').
The script also looks for the flag of the pregnancy box, tape location 353, and determines whether a pregnancy checkbox had been selected for the records selected by the CDC.
Notes: The International Classification of Diseases, Tenth Revision (ICD-10) is a globally recognized system used for classifying diseases, health conditions, and related factors for statistical purposes. It is maintained by the World Health Organization (WHO) and serves as an international standard for reporting and analyzing health data.
ICD-10 provides a comprehensive framework for categorizing diseases and health conditions based on a system of codes and descriptors. It includes codes for a wide range of medical conditions, from infectious diseases and chronic illnesses to injuries and external causes of morbidity and mortality.
Python Script
#working version with plots

import pandas as pd
import matplotlib.pyplot as plt
import os

# Ensure the 'Mort' directory exists
if not os.path.exists('Mort'):
    os.makedirs('Mort')

def check_include_codes(codes):
    for code in codes:
        if code == 'A34' or code == 'O98' or code == 'O99':
            return True
        if len(code) == 3 and code[0] == 'O':
            num_part = code[1:]
            if num_part.isdigit():
                num_value = int(num_part)
                if 0 <= num_value <= 95:
                    return True
    return False

def check_exclude_codes(codes):
    for code in codes:
        if len(code) != 0:
            prefix = code[0]
            num_part = code[1:]
            if num_part.isdigit():
                num_value = int(num_part)
                if prefix in {'V', 'W', 'X'} and 0 <= num_value <= 99:
                    return True
                if prefix == 'Y':
                    if 0 <= num_value <= 36 or 85 <= num_value <= 89:
                        return True
    return False

def process_data(file_path):
    num_preg = 0
    alt_method_include_codes_check = 0
    cdc_count_include_codes = 0
    cdc_method_and_preg = 0
    count_meeting_criteria = 0

    with open(file_path, 'r') as file:
        while True:
            line = file.readline()
            if not line:
                break

            gender = line[68]
            age_type = line[69]
            age = int(line[70:73].strip())

            if gender == 'F' and age_type == '1' and 15 <= age <= 44:
                underlying_codes = [line[145:148].strip()]
                cod_codes = [line[j:j+3].strip() for j in range(166, 303, 7)]
                cdc_include_codes_check = check_include_codes(underlying_codes)
                alt_method_include_codes_check = check_include_codes(cod_codes)
                alt_method_exlude_codes_check = check_exclude_codes(underlying_codes)

                if alt_method_include_codes_check and not alt_method_exlude_codes_check:
                    count_meeting_criteria += 1

                if line[352] == '1':
                    num_preg += 1
                    if cdc_include_codes_check:
                        cdc_method_and_preg += 1

                if cdc_include_codes_check:
                    cdc_count_include_codes += 1

    return {
        'Alternative Method': count_meeting_criteria,
        'Num Preg': num_preg,
        'CDC Method': cdc_count_include_codes,
        'CDC Method AND Preg': cdc_method_and_preg
    }

files = [
    'mort_2018', 'mort_2019', 'mort_2020', 'mort_2021', 'mort_2022'
]

# Path to data files and extension
data_folder = '/home/dev/Mort/'
file_paths = [data_folder + file for file in files]

results = {file.split('_')[-1]: process_data(file_path) for file, file_path in zip(files, file_paths)}
df = pd.DataFrame.from_dict(results, orient='index')

# Save the DataFrame to Excel
df.to_excel('Mort/Mort_Analysis.xlsx')

# Plotting each column as a bar chart
for column in df.columns:
    plt.figure()
    df[column].plot(kind='bar')
    plt.title(column)
    plt.xlabel('Year')
    plt.ylabel('Count')
    plt.savefig(f'Mort/{column.replace(" ", "_")}_chart.png')

print(df) | A guest post by
|